A visualization for understanding the distribution of salaries of workers in the tech industry. This project was something I worked on with a group while taking CPSC 447 at UBC.
Data Dictionary
The following data was processed from Salaries for Jobs in Data Science and Tech (removed):
| Attribute | Type | Cardinality/Range |
|---|---|---|
| company | Categorical | 1631 |
| title | Categorical | 15 |
| basesalary | Quantitative | [0, 1659870] |
| yearsofexperience | Quantitative | [0, 69] |
| yearsatcompany | Quantitative | [0, 69] |
| location | Categorical | 1050 |
This dataset consists of tech salary information from North America recorded in the time between January 1st, 2019 and September 9th, 2020.
Views
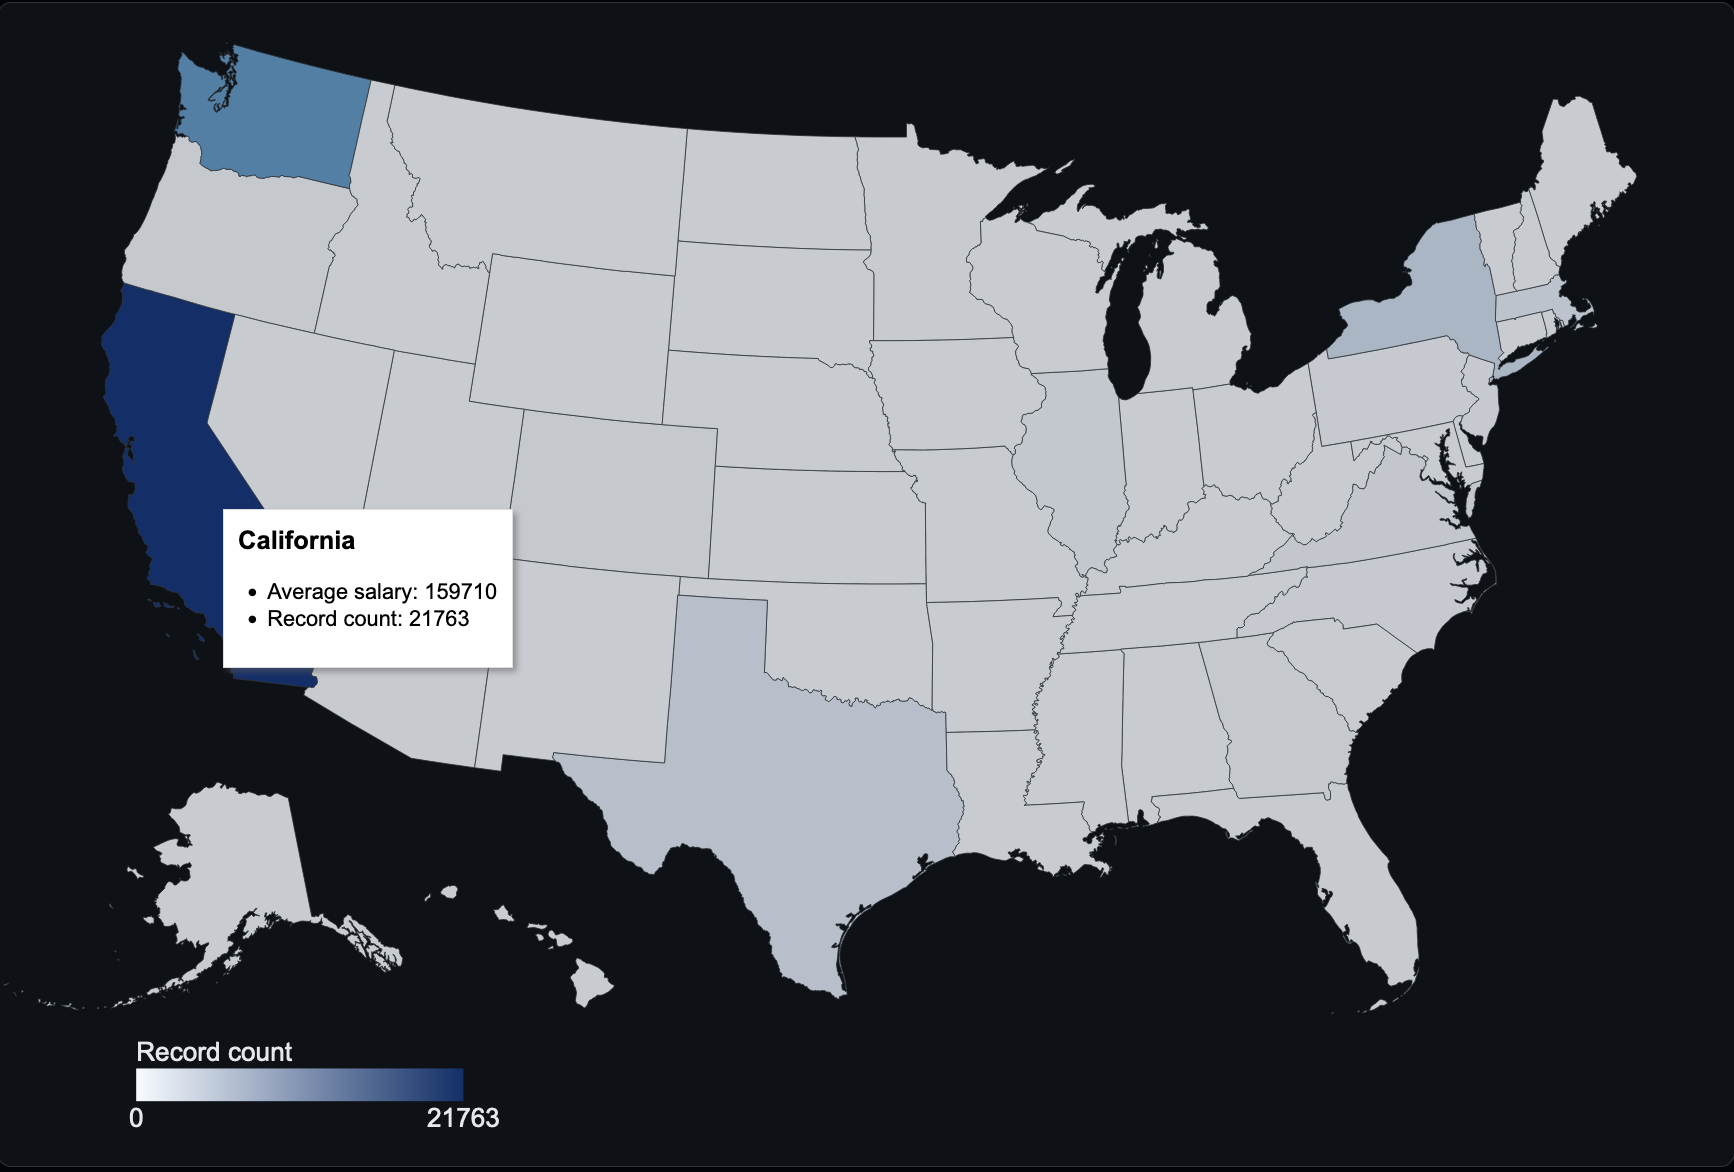
Geographic distribution of workers
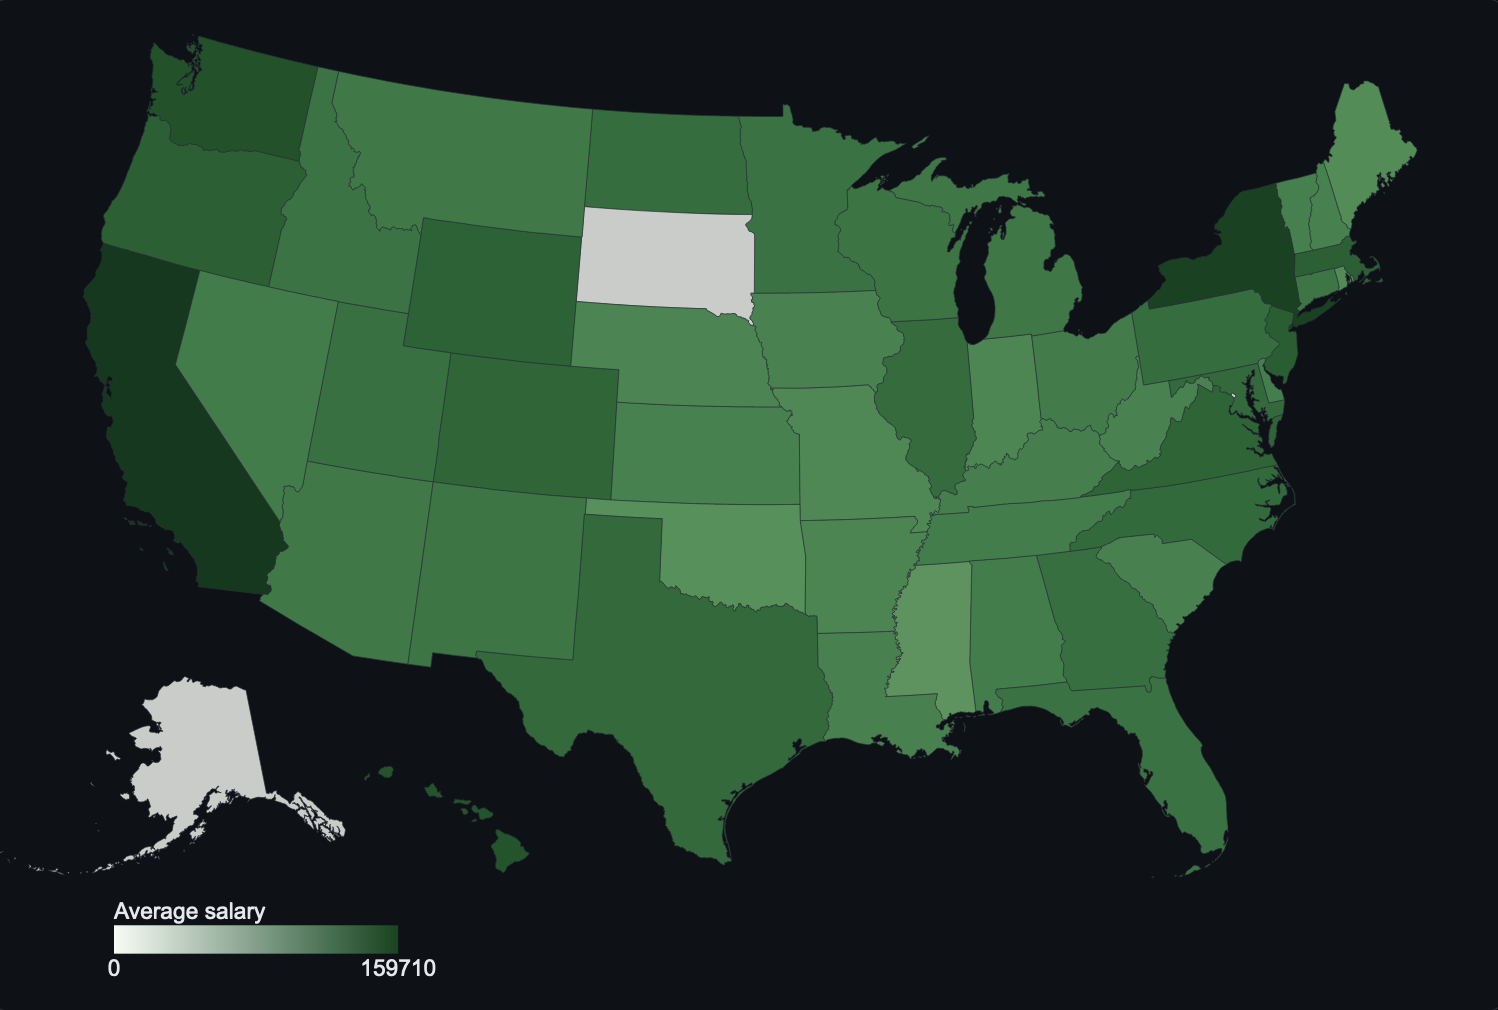
Geographic distribution of worker salaries
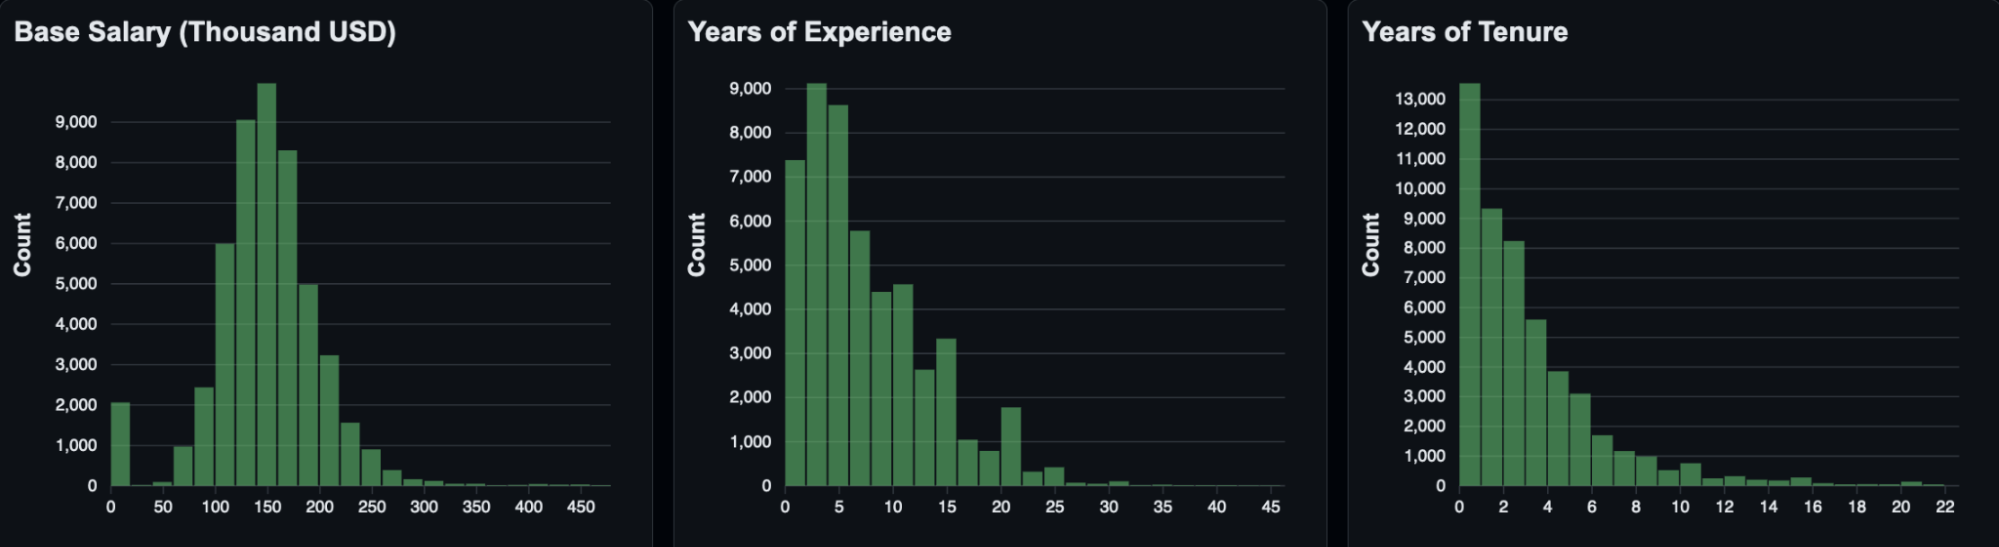
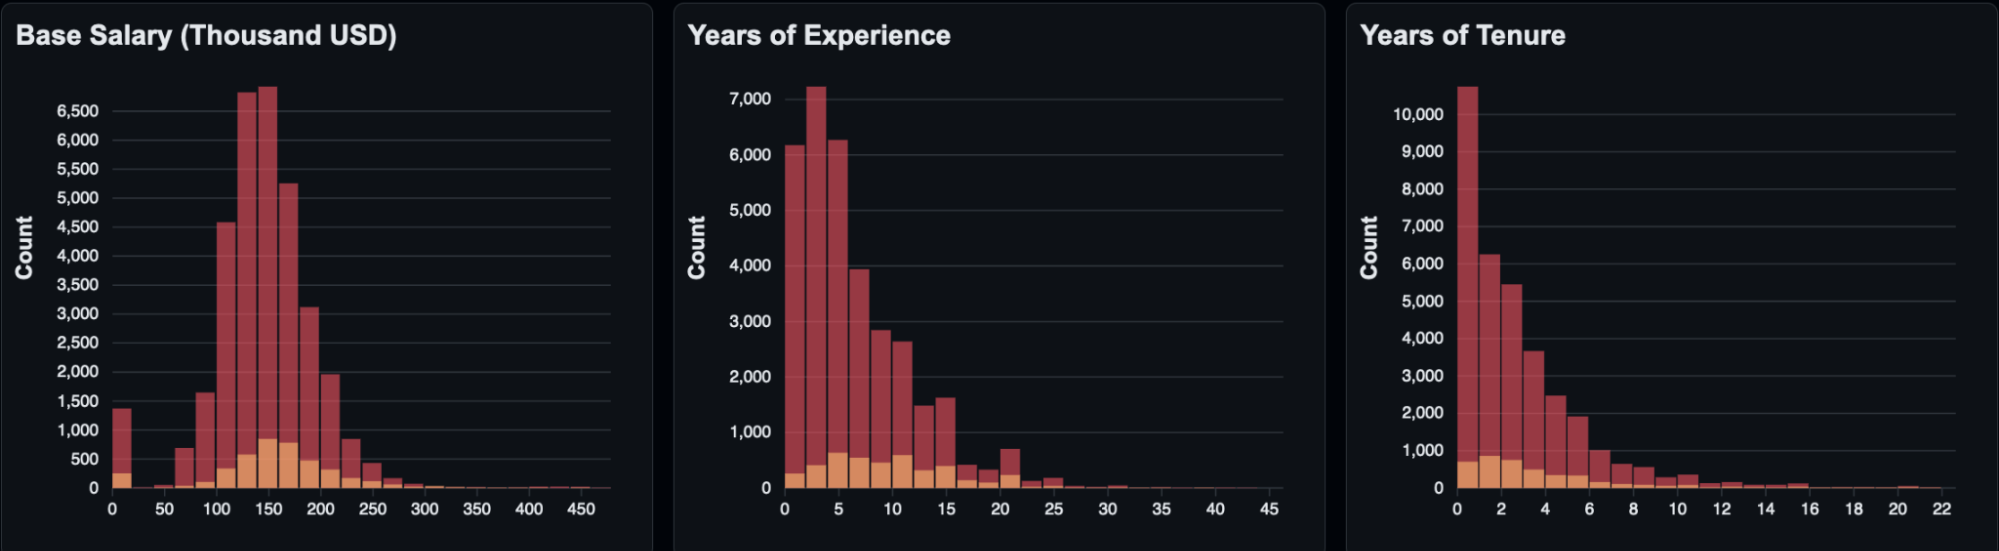
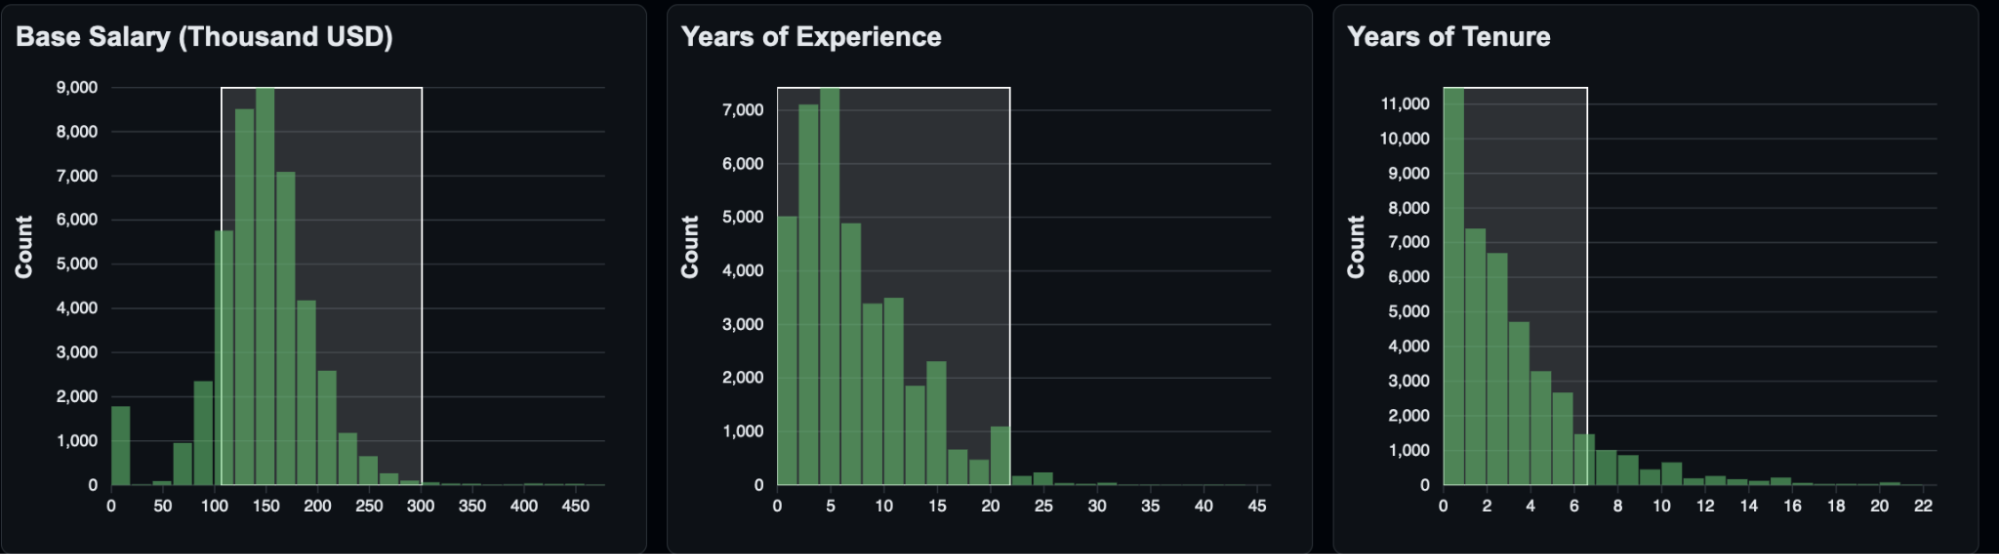
Histograms of worker salary, years of experience, and tenure
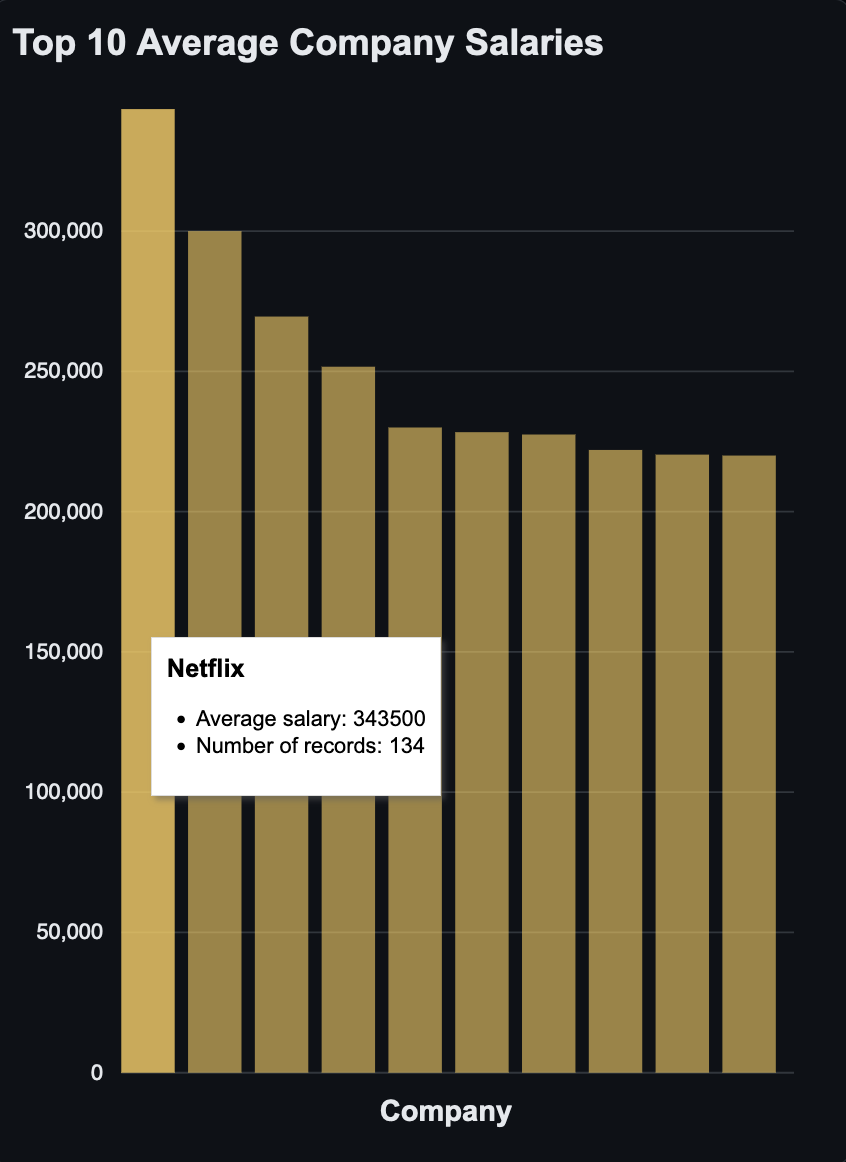
Bar chart of the companies with the most amount of salary records